
Total Sales: Metrics, Measurement & Revenue Growth
Learn how to track total sales effectively, avoid common pitfalls, and leverage this critical metric to drive revenue growth in B2B sales operations.
published
Understanding total sales is fundamental to running a successful business, yet many sales leaders struggle to measure this metric accurately or leverage it for strategic decisions. Total sales represents the complete revenue generated from all transactions within a specific period, providing a comprehensive view of business performance before any deductions or adjustments. For B2B sales teams managing complex product lines, multiple channels, and extended sales cycles, tracking this metric correctly becomes even more critical. The challenge is not just calculating the number, but extracting actionable insights that drive growth and operational improvements.
What Total Sales Actually Measures
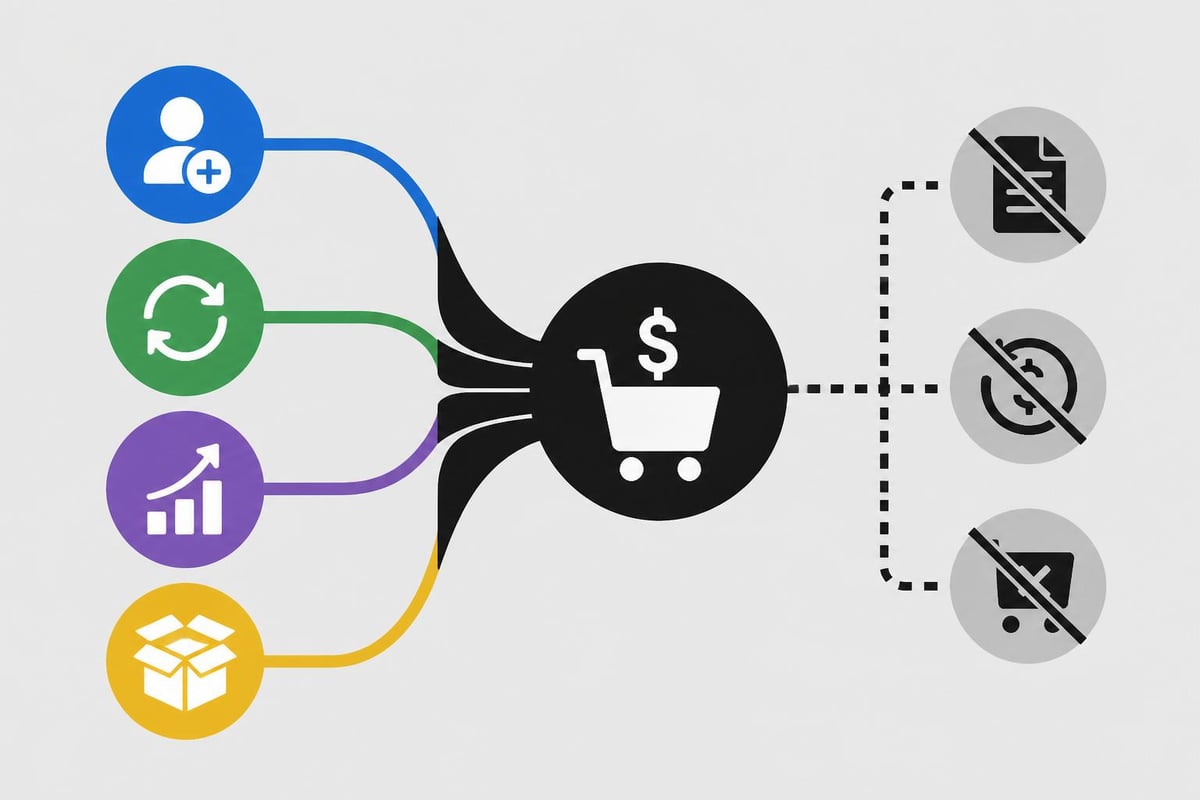
Total sales encompasses every revenue-generating transaction your business completes within a defined timeframe. This includes all products sold, services rendered, and contracts signed, regardless of payment status or fulfillment completion. The metric differs from gross sales, which includes the initial transaction value before any returns or allowances, and net sales, which factors in deductions.
Key components that contribute to total sales include:
Direct product sales across all channels
Service contracts and subscriptions
Recurring revenue from existing customers
One-time project fees and consulting engagements
Upsells and cross-sells to current accounts
The timeframe you choose matters significantly. Monthly total sales tracking helps identify short-term trends and seasonal patterns, while quarterly and annual views provide strategic insights for planning and forecasting. B2B companies often face the challenge of recognizing revenue when deals close versus when payment arrives, making accurate total sales tracking more complex than simple transaction counting.
Common Mistakes in Total Sales Calculation
Many organizations inadvertently inflate or deflate their total sales figures by including or excluding the wrong elements. Pending deals that have not officially closed should never count toward total sales, even if they appear certain. Similarly, refunded transactions need careful handling to avoid double-counting revenue that was later reversed.
What to Include | What to Exclude | Common Gray Areas |
|---|---|---|
Completed transactions | Pending proposals | Verbal commitments |
Signed contracts | Forecasted deals | Letters of intent |
Recurring subscriptions | Refunded sales | Trial periods |
Upsells and renewals | Canceled orders | Payment plans |
The distinction between total sales and other revenue metrics creates confusion in many sales organizations. Understanding total sales as a distinct metric from net revenue or gross margin helps teams focus on the right priorities during different planning cycles.
Tracking Total Sales Across Multiple Channels
Modern B2B sales teams operate across numerous channels simultaneously, from direct sales representatives to partner networks, online platforms, and reseller relationships. Each channel generates revenue differently, with varying sales cycles, deal sizes, and recognition timelines. Consolidating these diverse streams into accurate total sales figures requires systematic processes and reliable technology.
Direct sales typically represent the most straightforward channel to track, with clear attribution to individual representatives and teams. Partner and reseller channels introduce complexity because revenue recognition may lag behind the actual customer transaction. Online sales platforms provide immediate transaction data but may include trial conversions that need separate categorization.
Building a Unified View
Creating a single source of truth for total sales demands integration across your technology stack. CRM systems, accounting platforms, e-commerce solutions, and partner portals all hold pieces of the revenue puzzle. Without proper consolidation, teams resort to manual spreadsheet compilation that introduces errors and delays strategic decision-making.
Sales systems that unify these disparate data sources eliminate the gaps where revenue falls through the cracks. When your team can view total sales across all channels in real-time, you gain the ability to shift resources toward high-performing areas and address underperforming segments before they impact quarterly results.
Benefits of unified total sales tracking include:
Faster identification of revenue trends and anomalies
Accurate sales forecasting based on complete data
Better resource allocation across channels and products
Improved commission calculations and compensation accuracy
Enhanced investor and stakeholder reporting
The complexity increases when dealing with multi-year contracts, phased implementations, or usage-based pricing models common in B2B software and services. These arrangements require careful consideration of when to recognize revenue as part of total sales versus deferred revenue that will be recognized over time.
Using Total Sales for Strategic Decisions
Beyond basic reporting, total sales data drives critical business decisions when analyzed properly. Revenue trends reveal which products resonate with customers, which markets show growth potential, and which sales motions generate the highest returns. The metric serves as a foundation for capacity planning, hiring decisions, and market expansion strategies.
Year-over-year total sales comparisons help leadership teams assess whether growth initiatives are working. A 15% increase in total sales might seem positive until you realize the market grew 25% during the same period, indicating lost market share. Conversely, flat total sales during a market contraction might represent impressive competitive performance.
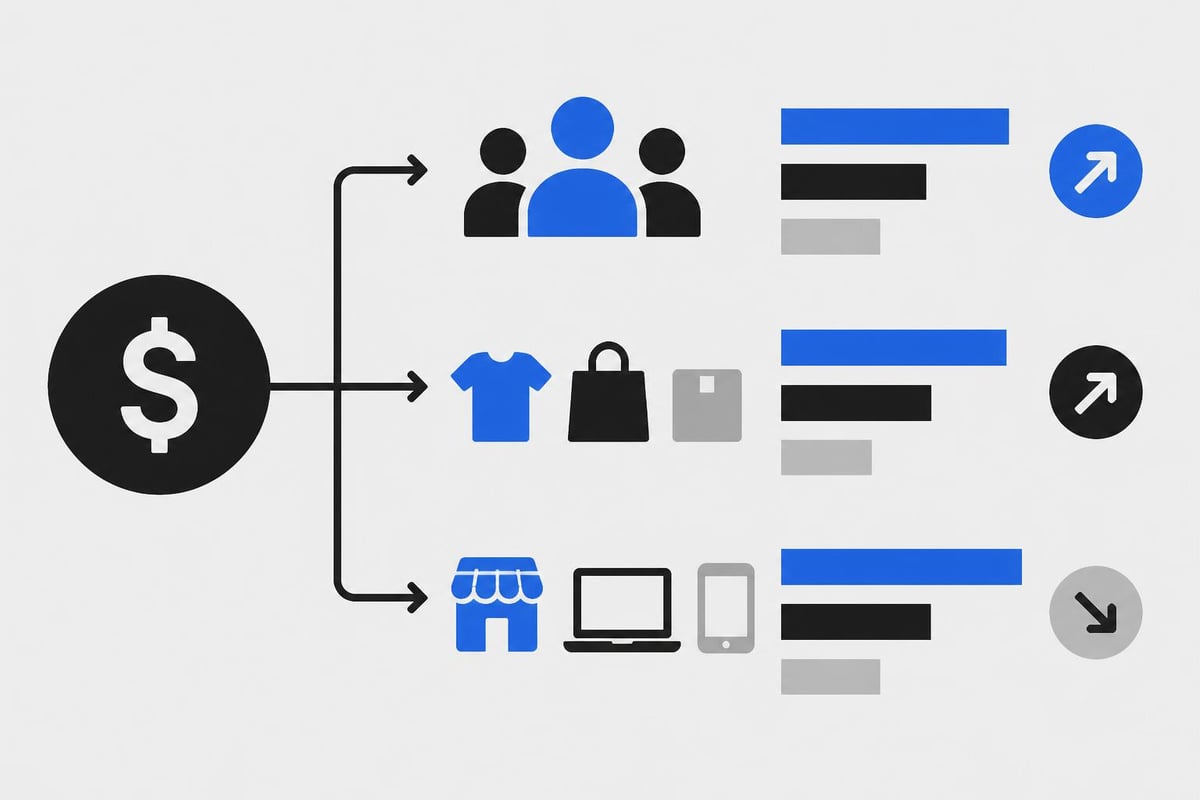
Segmentation Analysis
Breaking down total sales by customer segment, product category, geographic region, or sales representative reveals insights that aggregate numbers hide. A healthy overall total sales figure might mask concerning declines in key accounts or strategic product lines that deserve immediate attention.
Customer segment analysis: Which customer types generate the most revenue and profit
Product performance: How individual offerings contribute to total sales growth
Geographic distribution: Where expansion opportunities exist based on current performance
Sales team productivity: Which representatives and methodologies drive results
Calculating total sales in platforms like Tableau enables dynamic segmentation that updates automatically as new data arrives. This real-time visibility helps sales leaders make informed decisions about territory assignments, quota distribution, and coaching priorities.
The relationship between total sales and other operational metrics provides context that raw numbers cannot. If total sales increase by 20% while sales cycle length extends by 35%, you might be winning larger deals but sacrificing velocity. These tradeoffs require strategic evaluation based on business objectives and market position.
Optimizing Sales Operations Around Total Sales Goals
Setting total sales targets without considering operational capacity leads to either missed quotas or burned-out teams. Effective planning requires understanding your conversion rates, average deal sizes, sales cycle lengths, and representative productivity levels. These factors determine how many opportunities you need to generate realistic total sales outcomes.
The sales capacity formula connects these elements:
Total Sales Target ÷ Average Deal Size = Required Closed Deals
Required Closed Deals ÷ Close Rate = Required Qualified Opportunities
Required Qualified Opportunities ÷ Qualification Rate = Required Top-of-Funnel Leads
This reverse-engineering approach reveals whether your total sales goals align with realistic operational capabilities. A $10 million annual total sales target with a $50,000 average deal size requires 200 closed deals. If your close rate sits at 25%, you need 800 qualified opportunities, which might demand more sales development resources than currently allocated.
Process Efficiency Gains
Many organizations focus exclusively on generating more leads to increase total sales, while ignoring process inefficiencies that prevent existing opportunities from converting. Sales representatives spending 60% of their time on administrative tasks rather than customer interactions represent a massive drag on total sales potential.
Methods to calculate total sales in Excel remain common in many organizations, but this manual approach creates bottlenecks and errors. Representatives updating multiple spreadsheets, reconciling data across systems, and generating custom reports cannot simultaneously focus on revenue-generating activities. The opportunity cost of these inefficiencies often exceeds the investment required to streamline operations.
Inefficiency Type | Impact on Total Sales | Solution Approach |
|---|---|---|
Manual data entry | Lost selling time | Automated data capture |
Disconnected systems | Delayed insights | Integrated platforms |
Unclear processes | Inconsistent execution | Documented workflows |
Poor lead routing | Slow response times | Intelligent assignment |
Technology should amplify sales effectiveness, not add complexity. When representatives juggle five different tools to move a deal forward, friction accumulates at every stage. Consolidating these fragmented systems into a unified environment removes barriers between salespeople and revenue generation.
The Role of AI in Total Sales Growth
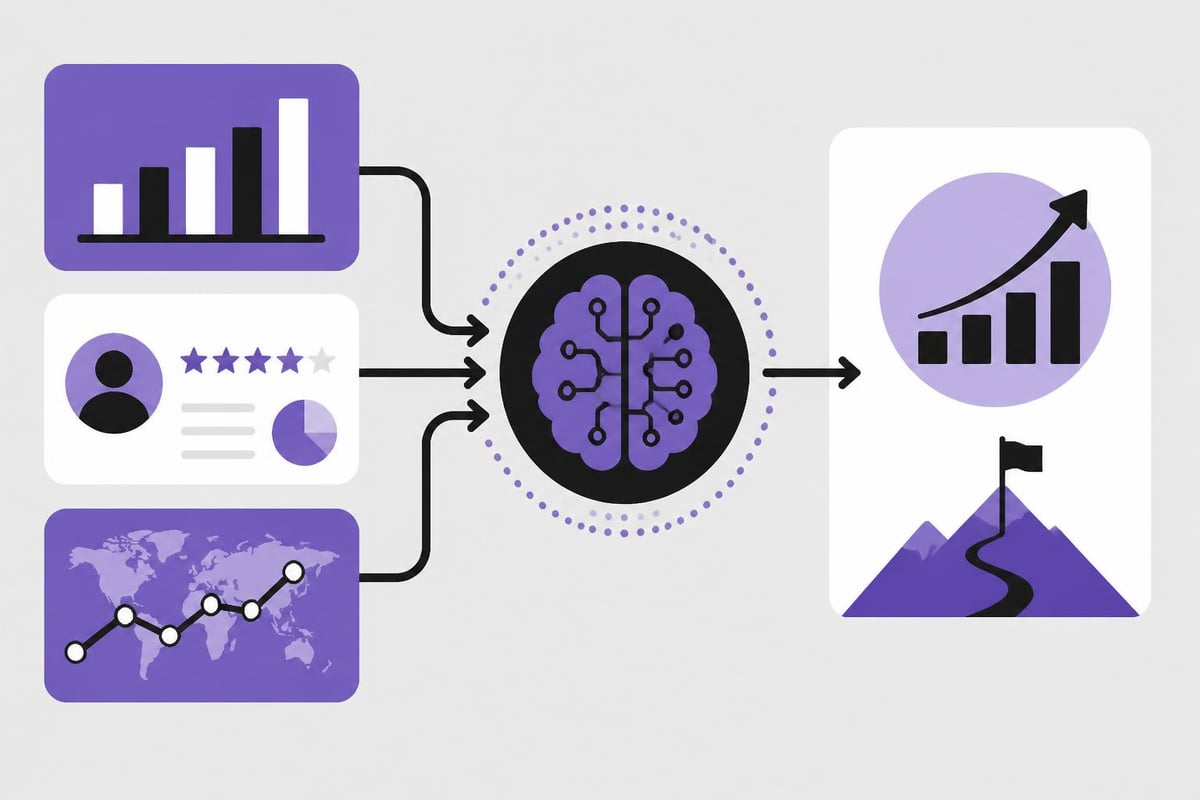
Artificial intelligence transforms how sales teams approach total sales optimization, but implementation requires strategic focus on areas that genuinely move the needle. AI excels at pattern recognition, prediction, and automation, making it valuable for forecasting total sales trends, identifying at-risk deals, and automating repetitive tasks that consume selling time.
Predictive analytics powered by AI can forecast total sales outcomes with greater accuracy than traditional methods by analyzing thousands of variables simultaneously. These systems identify which deals will likely close, which customers might churn, and which prospects show buying signals similar to past successful conversions.
High-impact AI applications for total sales growth:
Lead scoring that prioritizes opportunities most likely to convert
Automated follow-up sequences that maintain engagement without manual effort
Deal intelligence that surfaces risks and opportunities in active pipeline
Conversation analysis that identifies successful sales techniques
Forecasting models that predict total sales with increasing accuracy
The key is focusing AI implementation on specific problems rather than applying technology broadly. A custom AI solution designed around how your team actually sells delivers more value than generic tools that require significant adaptation. Understanding where AI actually moves the needle in B2B sales prevents wasted investment in capabilities that do not impact total sales performance.
Data Quality Foundations
AI systems are only as effective as the data they process. Inconsistent CRM hygiene, incomplete customer records, and siloed information sources undermine AI capabilities regardless of algorithmic sophistication. Before implementing AI to optimize total sales, organizations must establish data quality standards and governance processes.
Total sales definitions vary across industries and applications, making consistent measurement critical for accurate AI training. When your historical data mixes different revenue recognition methods, includes inconsistent categorizations, or contains significant gaps, AI models produce unreliable predictions that hurt rather than help decision-making.
Industry-Specific Total Sales Considerations
Different industries face unique challenges in measuring and optimizing total sales. Subscription businesses must balance new customer acquisition revenue with renewal rates and expansion revenue from existing accounts. Manufacturing companies deal with large purchase orders that create lumpy revenue patterns. Professional services firms track billable hours and project completion alongside product sales.
The restaurant industry, for example, tracks total sales across dine-in, takeout, delivery, and catering channels, each with different margins and operational requirements. B2B technology companies managing annual contracts face the challenge of recognizing revenue properly while accurately tracking total sales for performance management.
Industry-specific total sales tracking considerations:
SaaS and subscription models: Monthly recurring revenue versus total contract value
Manufacturing: Order backlog versus recognized sales revenue
Professional services: Project-based revenue recognition and milestone billing
Financial services: Commission-based revenue and fee structures
Healthcare: Insurance reimbursements and patient payment complexities
For B2B sales teams selling complex solutions, total sales calculation must account for multi-phase implementations, variable pricing components, and contract modifications that occur throughout customer relationships. The initial signed contract value may differ significantly from the actual total sales recognized as the engagement progresses.
Contractual Nuances
Understanding total sales in contractual contexts becomes essential when agreements include performance-based components, volume discounts, or conditional terms. A contract promising $500,000 in total sales over two years might include provisions that adjust pricing based on usage levels or achievement of specific milestones.
These complexities require clear policies about when revenue counts toward total sales targets. Does a $1 million deal signed on December 31st count toward Q4 total sales if implementation begins in Q1? Different organizations answer this question differently, but consistency matters more than the specific policy chosen.
Building Accountability Around Total Sales Metrics
Total sales targets lose effectiveness when accountability remains unclear. Individual contributors, team leaders, and executive stakeholders need specific ownership over components that roll up into organizational total sales goals. This cascading accountability structure ensures everyone understands their contribution to overall performance.
Sales representatives typically carry individual quotas that aggregate into team total sales targets. Managers own team performance while providing support and removing obstacles that prevent representatives from reaching their numbers. Executive leadership maintains accountability for strategic decisions about market focus, product investment, and resource allocation that enable total sales achievement.
Transparent reporting systems that show progress toward total sales goals at every organizational level create healthy competitive dynamics and early warning systems. When a region falls behind target in month one of a quarter, leadership can investigate causes and implement corrective actions before the gap becomes insurmountable.
Effective total sales accountability includes:
Clear individual and team quotas tied to organizational targets
Regular progress reviews with specific improvement actions
Transparent performance dashboards accessible to relevant stakeholders
Compensation structures that align individual incentives with total sales goals
Recognition programs that celebrate achievement and progress
The measurement frequency impacts accountability effectiveness. Quarterly reviews arrive too late to course-correct on failing strategies, while daily scrutiny creates unproductive stress. Most successful organizations track total sales weekly, review trends biweekly, and conduct formal assessments monthly.
Technology Stack Optimization for Total Sales Visibility
The average sales team uses eight different tools to manage their process, creating fragmented data and incomplete visibility into total sales performance. CRM platforms, marketing automation, proposal software, communication tools, analytics dashboards, and accounting systems each hold pieces of information needed for accurate total sales tracking.
Integration challenges arise when these systems do not communicate effectively. Manual data transfers between platforms introduce errors and delays. Representatives duplicate effort entering information into multiple systems. Leaders lack real-time visibility because report generation requires pulling data from numerous sources.
Auditing your sales tech stack reveals redundancies, gaps, and opportunities for consolidation that improve total sales visibility. Many organizations discover they pay for capabilities they do not use while lacking critical functionality in areas that matter most.
System Category | Total Sales Impact | Integration Priority |
|---|---|---|
CRM platform | High - Primary revenue data source | Critical |
Marketing automation | Medium - Lead source tracking | High |
Proposal software | Medium - Deal size and timing | High |
Communication tools | Low - Activity tracking only | Medium |
Analytics dashboards | High - Reporting and insights | Critical |
Accounting systems | Critical - Revenue recognition | Critical |
The goal is not minimizing the number of tools but maximizing the value delivered per tool while ensuring seamless data flow between systems. A well-designed sales system eliminates manual handoffs, provides single-entry data capture, and delivers comprehensive total sales visibility without requiring representatives to navigate multiple platforms.
Advanced Total Sales Analysis Techniques
Beyond basic tracking, sophisticated analysis techniques extract deeper insights from total sales data. Cohort analysis reveals how customer groups acquired during different periods perform over time, showing whether total sales growth comes from new customer acquisition or existing customer expansion. Trend decomposition separates seasonal patterns from underlying growth trajectories.
Statistical methods like regression analysis identify which variables correlate most strongly with total sales performance. You might discover that sales cycles shorter than 45 days close at twice the rate of longer cycles, suggesting a strategic focus on deal acceleration. Or that customers from certain industries generate 3x higher lifetime total sales value, indicating where marketing resources should concentrate.
Advanced analytical approaches include:
Cohort retention analysis tracking customer groups over time
Predictive modeling forecasting future total sales based on current pipeline
Attribution analysis determining which touchpoints contribute to revenue
Elasticity testing showing how pricing changes affect total sales volume
Comparative benchmarking measuring performance against industry standards
Calculating total sales using various formulas provides the foundation, but transforming calculations into strategic insights requires analytical sophistication. The question is not just "what were total sales last quarter" but "why did total sales perform that way, and what should we do differently."
Balancing Metrics
Total sales should not be examined in isolation. Pursuing total sales growth while sacrificing profitability creates unsustainable business models. Increasing total sales by offering steep discounts might hit revenue targets while destroying margins. The relationship between total sales, gross profit, customer acquisition cost, and lifetime value determines business health more than any single metric.
Methods for finding total sales must account for returns, allowances, and discounts to provide accurate pictures of business performance. The difference between gross total sales and net sales often reveals important trends in customer satisfaction, product quality, or pricing strategy effectiveness.
Mastering total sales measurement and optimization separates high-performing sales organizations from those struggling to understand their revenue dynamics. The key is building systems that provide accurate, timely visibility while enabling the strategic analysis that drives continuous improvement. If your team spends more time reconciling data than acting on insights, erakraft inc. can help you build a unified sales system that eliminates the bloat, streamlines your processes, and gives you the clarity needed to focus on what matters most: closing deals and growing revenue.
Article written using RankPill.
